10 Surprising Renewable Energy Statistics for 2023

As the planet faces the threat of climate change, countries are shifting to greener alternatives at an exponential rate.
First-world and developing countries alike are laying the foundations for massive renewable energy-generating power plants. As the demand for electricity continues to grow, countries must ramp up renewable energy production beyond that demand to make a difference.
For that reason, the International Energy Agency created a Net Zero Emissions by 2050 Scenario (NZE). This scenario presents a pathway for the world’s energy sector to achieve net zero greenhouse gas emissions by 2050.
We collected 10 important renewable energy statistics to give you an idea of where we are with the NZE scenario today.
1. Renewable energy makes up 28.1% of the world’s electricity production
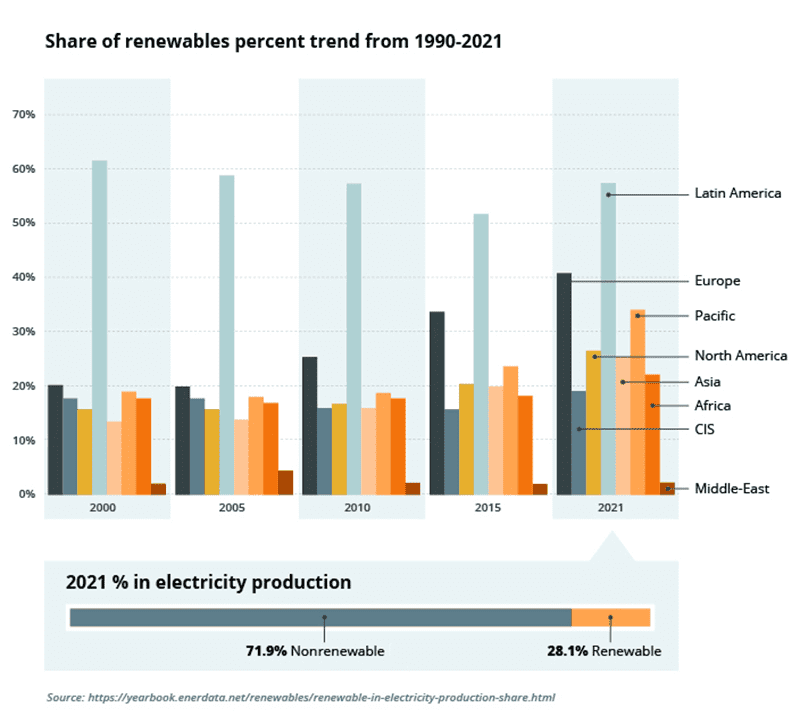
This is an increase from 2019 levels (26.3%) but not nearly enough of an improvement to meet the NZE scenario.
For the time being, Iceland is the only country considered to be running completely on renewable energy. In 2020, only 0.0001% of Iceland’s energy production was from traditional fuel generation.
Norway comes in second in renewable electricity generation, with 99% of the country’s electricity generation coming from various renewable sources.
Norway is followed by New Zealand at 80.9%, Brazil at 78.4%, Colombia at 74.5%, and Canada at 68%. Brazil’s high renewable capacity is due primarily to the significant number of hydro power stations in the nation’s rivers.
World energy data sets show that Latin America is leading the world in clean energy use. Due to the availability of plentiful hydroelectric opportunities, 57.5% of the region’s energy production comes from renewable sources, the highest in the world. However, this is a decrease from two decades ago, when the percentage of renewable energy consumption in Latin America was even higher, at 61.6%.
This decrease is due to rapidly expanding and developing economies where the amount of energy needed is increasing at a higher rate than the deployment of new clean energy plants.
Europe comes in second with 40.7% of all energy generation through renewable sources. Countries like Norway, Sweden, Portugal, Spain, Germany, and Italy are at the forefront of renewable energy production in Europe.
The Middle East has the lowest reliance on renewable energy with only 2.2% of energy production from renewable sources. This is primarily due to an abundance of oil in Middle Eastern countries, making it less expensive to use fossil fuel-based power than other energy technologies.
Source: Enerdata
2. Global renewable energy capacity will increase by 2,400 GW between 2022 and 2027
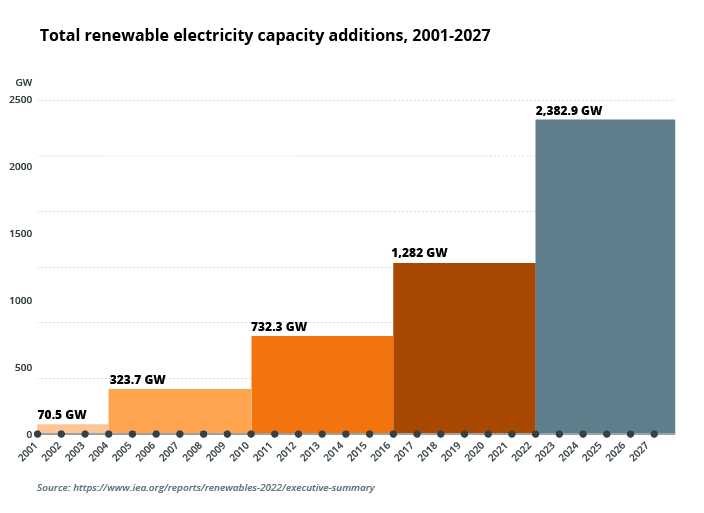
This growth would be roughly equal to China’s entire power capacity today. And it would increase global renewable power in five years as much as it increased in the past 20.
In comparison, between 2001 and 2004, the growth of total renewable electricity capacity amounted to 70.5 GW.
By 2027, projections indicate renewables will account for more than 90% of all global electricity expansion efforts. This is primarily driven by China, the EU, the US, and India.
Due to recent increases in fossil fuel prices following Russia’s invasion of Ukraine, many countries have strengthened their policies regarding renewables. There is a higher emphasis on solar power and wind generation, especially in non-tropical regions.
Renewables are on track to become the largest source of electricity generation in the world by the end of 2027, surpassing coal and accounting for 35% of all production.
Source: IEA
3. The global renewable energy market size will increase from $1.093 trillion in 2023 to $2.026 trillion by 2030
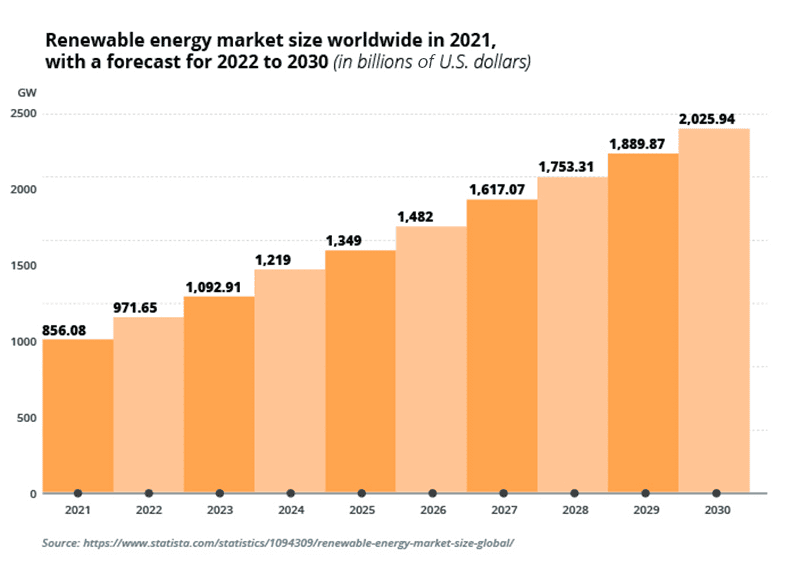
Rapid urbanization, economic growth, and fossil fuel consumption collectively add to the growth of the renewable energy market.
Forecasts are based on a CAGR of 9.6% between 2022 and 2030. However, since many countries are accelerating their renewable energy generation production capacity with evolving policies, there’s a good chance that the market will be even bigger than projected by 2030.
Meanwhile, the fossil fuel market is growing at a CAGR of 6.2% and is expected to reach $1.050 trillion by the end of 2023. However, projections indicate a steady decline in the growth rate of the fossil fuel market moving forward.
By 2027, the fossil fuel market size is expected to reach $1.313 trillion with a CAGR of 5.8%. In comparison, the renewable energy market is expected to reach $1.617 trillion that same year.
Source: Statista
4. The world had a total renewable generation capacity of 3,372 GW at the end of 2022
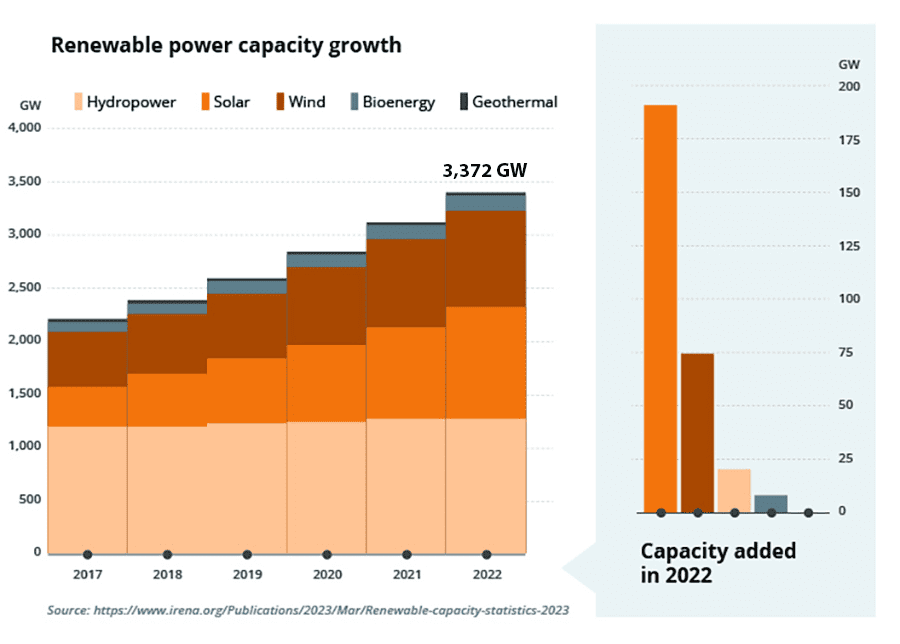
Last year the majority of countries focused on increasing solar energy generation, while developed countries like the US also focused on increasing wind power generation.
Currently, solar power is the highest-growing renewable energy generation source, with wind power in second place. That’s followed by hydropower and bioenergy.
Furthermore, Asia’s total renewable energy generation was 1,630 GW. That makes up for 48.33% of all renewable energy generation. The majority of this renewable energy generation is spearheaded by China, accounting for 1,160 GW of electricity generation.
At any rate, considering that the total renewable generation capacity was 1,566 GW in 2013, it’s more than doubled in the last decade. And the renewable power capacity of the world continues to expand at an increasing rate.
Source: IRENA
5. Hydropower is used more than any other renewable energy source in the world, with a total energy generation of 1,392 GW in 2022

This figure includes pure pumped storage hydropower, which adds a capacity of 137 GW. Excluding it, the share of renewable hydropower last year was 1,256 gigawatts (GW).
Solar (1,053 GW) and wind energy (899 GW) were the second and third largest capacities. Bioenergy had a capacity of 149 GW, geothermal energy had 15 GW, and marine energy had 524 megawatts (MW).
Regardless, hydropower is not the fastest-growing method of renewable energy generation. In comparison, in 2013, hydropower generated a total of 1,137 GW. Since hydroelectric power plant development is limited by the availability of free flowing water, the growth of hydropower plants is decreasing.
That’s why today a lot of countries are focusing on solar power and wind energy generation.
According to Heymi Bahar of the International Energy Agency (IEA), solar will account for 60% of every new power installation in the next five years. By 2027, experts predict solar power will not only surpass hydropower but also wind, natural gas, and coal.
Source: IRENA
6. China leads in renewable energy — experts project its capacity may increase 1,190.1 GW from 2022 to 2027
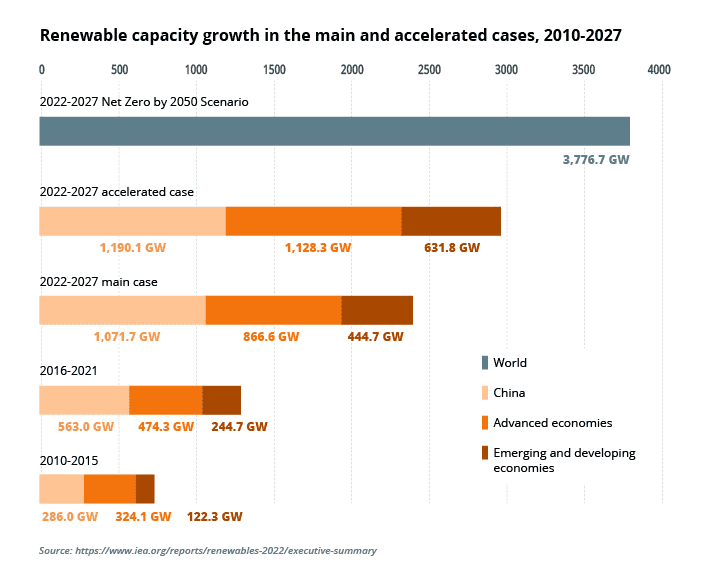
Projections show other advanced economies like the US, EU, Canada, Japan, and Australia may have a combined increase of 1,128.3 GW. Emerging and developing economies investing in a clean energy transition may have a total increase of 631.8 GW.
These projections account for an additional 25% compared to the main forecast, assuming countries address challenges with policy, regulations, permits, and financing. Main case projections are 1,071.7 GW for China, 866.6 GW for advanced economies, and 444.7 GW for emerging and developing economies.
China has significantly increased renewable energy generation in recent years. In fact, in the last five years alone the country has seen an 85% acceleration in renewable energy capacity expansion. This is due to rising fossil fuel prices and current global affairs.
Compared to 2021, the future forecasts have been revised by up to 30%, on average. That is due to China, the EU, the US, and India fast-tracking their existing policies while introducing new policies to combat the global energy crisis.
Source: IEA
7. Norway has the world’s largest share of renewables in electricity production at 99%
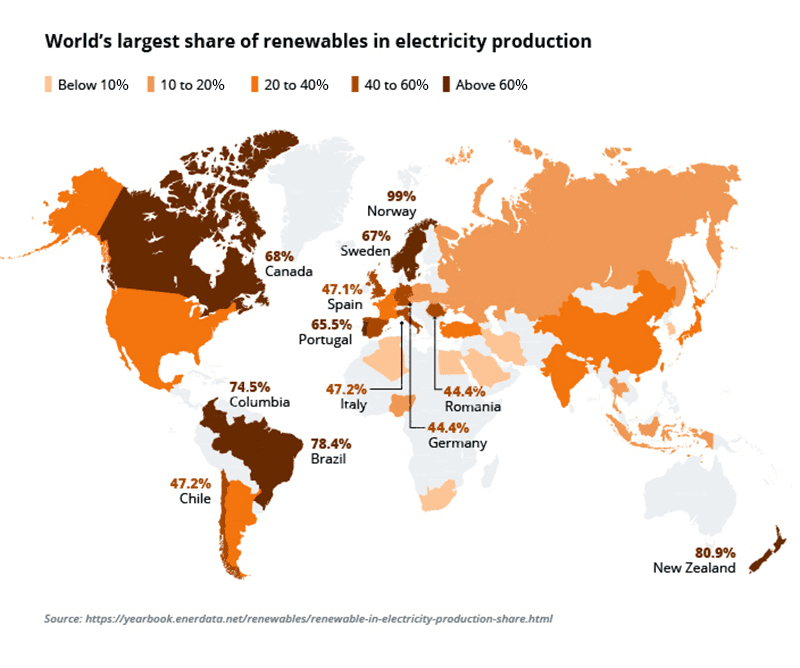
New Zealand is the runner-up, with 80.9% of its power coming from renewables. Other leading nations are Brazil with 78.4%, Colombia with 74.5%, and Canada with 68%.
While China is the largest producer of renewable energy, it accounts for only 28.8% of all energy production in the country. However, it’s still number one in Asia, followed by India where 20.4% of energy production is from renewable sources.
Regionally, Africa has the lowest renewable energy numbers, as its developing energy security is based on fossil fuels. Of the global population without access to electricity, 77% reside in Sub-Saharan Africa. Within the continent, Nigeria has the highest renewable energy share, with 19.8% of its energy production coming from renewable sources. South Africa comes in second at 9.2%.
In South America, Brazil is number one with 78.4% of their energy generation from renewable sources. That’s mostly due to the massive number of hydropower plants in the country.
The same is true for Colombia, which comes in second in South America, with 74.5% of all energy generation from renewable sources. Colombia is followed by Chile at 47.2% and Argentina at 24.5%.
In North America, Canada leads the continent with 68% of all energy generation from renewable sources. Canada is followed by Mexico at 21.9% and the United States at 20.5%.
In Oceania, New Zealand comes in first where 80.9% of all energy generation is from renewable sources. That’s followed by Australia where 26.7% of power generation is from renewable energy plants.
As we mentioned in the first statistic on this list, Iceland is the only country in Europe (and the world) that can be considered 100% renewable. Rounding out the top renewable energy producers in Europe, Norway takes the lead with 99%, followed by Sweden at 67%, Portugal at 65.5%, Spain at 47.1%, Romania at 44.4%, and Germany and Italy at 41.5% and 41.4%, respectively.
Source: Enerdata
8. China leads in wind power energy generation with 655.6 TWh in 2022, followed by the US with 378.2 TWh
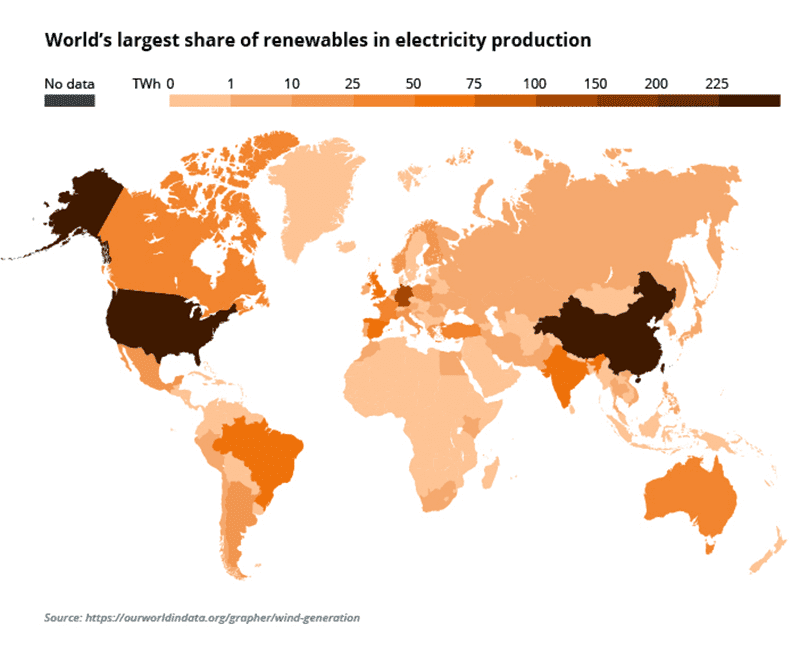
Since most developed nations have already utilized the majority of hydropower locations, their focus has turned toward solar and wind power energy generation, as solar and wind capacity are essentially limitless.
China has 44% of the global offshore wind turbine capacity, and there are plans to add even more turbines to Chinese waters.
As of 2022, global wind power generation was 1,848 TWh, total solar power generation was at 1,040 TWh, and total hydropower generation was 4,234 TWh. Meanwhile, other renewable sources like biofuel generated a total of 761 TWh that year.
In comparison, in 2000, onshore and offshore wind farms generated a total of 31.16 TWh, solar energy generated only 1.08 TWh of power, and hydropower plants generated 2,621.47 TWh, while other renewable sources accounted for 200.78 TWh of power.
In 2022, Germany had the third-highest wind energy generation at 126.1 TWh. Brazil followed with a total of 71.5 TWh of wind energy produced that year.
India was in fifth place with 68.09 TWh, followed by the United Kingdom at 65.02 TWh, Spain at 61.85 TWh, France at 38.46 TWh, and Canada at 35.21 TWh.
In total energy numbers, China generated 328.97 GW of wind energy power, the US generated 132.74, and Germany generated 63.76 GW.
Source: Our World in Data
9. By 2025, up to 35% of global power generation will be through renewable sources
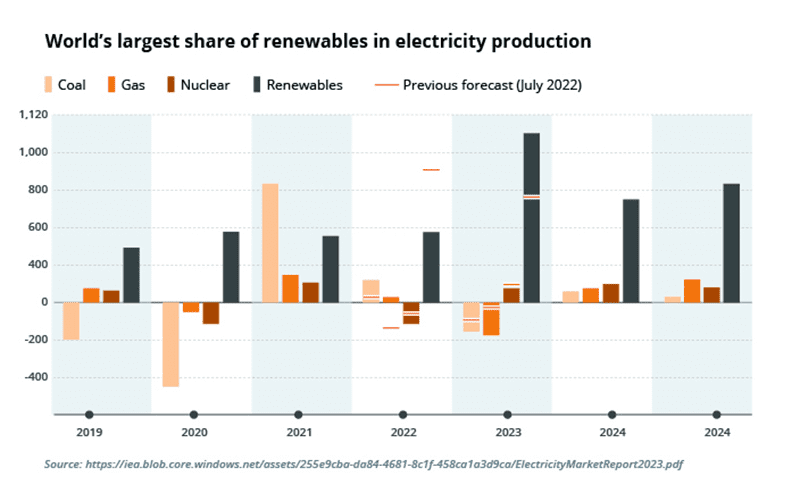
While the world’s electricity demand growth slightly slowed in 2022, it’s set to start rising again with more than 70% of the increased demand coming from China, India, and Southeast Asia.
Furthermore, projections show the share of coal and gas-fired generation will fall continuously in the coming years. However, due to droughts and other natural issues, there’s a chance that a lack of adequate hydropower may lead to more fossil fuel-based energy production.
However, that would be a temporary setback. Analysts predict Europe’s power generation emissions alone will decrease at an average rate of 10% each year through 2025.
That said, volatile weather changes will not only lead to droughts but also higher heat intensity, especially in countries like India. This is leading to unprecedented demand for electricity.
That is why many countries are updating their policies regarding renewable energy production.
Source: IEA
10. 21.5% of electricity in the US is generated through renewable sources
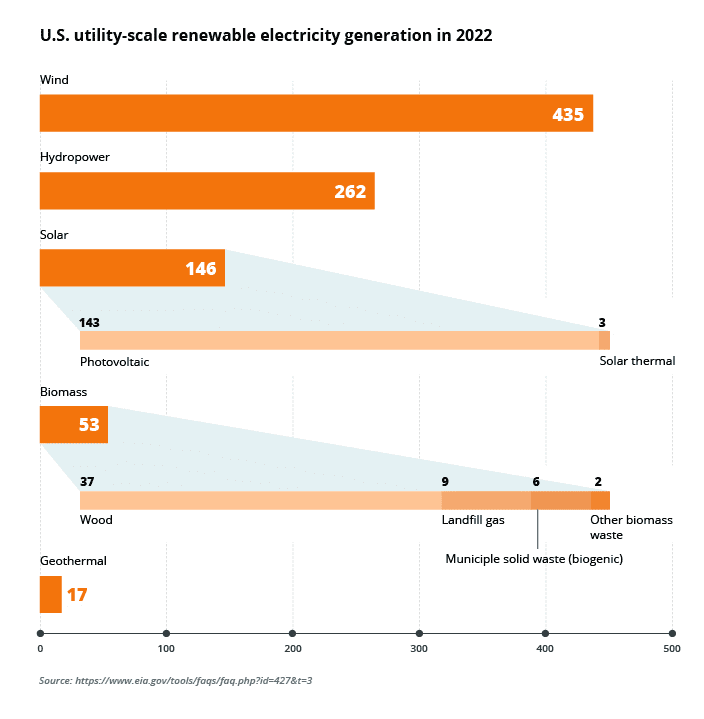
According to the US Energy Information Administration (EIA), wind energy accounts for 10.2% of all power generation, with hydropower (6.2%) and solar (3.4%) rounding out the top three. Meanwhile, 1.3% of power is generated through biomass such as wood, landfill gas, and municipal solid waste, and .4% of energy comes from geothermal sources.
However, 60.2% of the US’s electricity is still generated using fossil fuels while 18.2% is generated through nuclear power.
As of 2022, renewable energy accounted for 913 billion KWh of energy in the US. Of which, wind generation accounted for 435 billion KWh, hydropower accounted for 262 billion KWh, and solar energy accounted for 146 billion KWh.
Among fossil fuels, natural gas had the biggest share at 39.8%, which makes up 1,689 billion KWh, followed by coal at 19.5%, making up 828 billion KWh of energy.
Source: IEA
Final Thoughts
Emerging economies like China and India are at the forefront of renewable energy production. Meanwhile, the majority of the world still relies on fossil fuel energy production, especially the developing world. However, most developed countries today have strong renewable-first policies and incentives regarding energy generation, and intergovernmental organizations like the International Renewable Energy Agency (IRENA) are working to promote a clean energy future.
That said, based on current efforts and policy changes, the NZE scenario is a possibility. However, to achieve that throughout the world, developing economies will need to start investing more in renewable power generation in the coming decades.

