Fortune Telling With a Spreadsheet
The job was never to see the future. It was to stop pretending we could.


The job was never to see the future. It was to stop pretending we could.
Sign up for our magazine
The premier outlet for compelling storytelling around the innovators and innovations driving the clean energy transition.
While working at Duke Energy, there was a phrase I used with my team more than once over the years when large-load requests started arriving faster than our planning process could absorb them.
We were looking into a crystal ball.
I meant it as a joke about our situation. Looking back, it was a fairly precise description of what the organization was asking us to do. We were being handed fragments of information about projects that might or might not exist, and asked to produce a single number that people would spend billions of dollars against.
That’s not forecasting. That’s fortune telling with a spreadsheet.
The large load gaps
It’s worth being specific about the gaps, because “uncertainty” is a word that lets everyone nod without agreeing on anything. For a large new load, there were three things we couldn’t see.
- Whether the project would happen at all. A customer’s stated interest is not a decision. The same load gets shopped across multiple states and multiple utilities at once, and the announcement you’re reacting to is an opening position. Some projects arrived. Some arrived at half the size. Some went to a neighboring utility and we never heard why.
- When the load would come online. Not the date on the request. The actual date, which depends on permitting, equipment lead times, construction, and the customer’s own capital timeline. None of which the utility controls or fully observes.
- How fast the load would ramp up. This is the one people outside forecasting underestimate. Take a project that eventually reaches 800 megawatts. Getting there in six months, over two years, or over three years produces three completely different peak demand outlooks from identical total load. Same project, same megawatts, three different resource plans.
Multiply these unknown variables by dozens of projects and you’re not looking at a forecast with error bars; you’re looking at a distribution of futures, where a modest shift in a few assumptions moves the answer enough to change what gets built.
The trap is precision
What makes the crystal ball dangerous isn’t the uncertainty. Utilities have always planned under uncertainty.
It’s that the tools produce numbers to the decimal place regardless of what went into them. A spreadsheet sums an assumption just as neatly as it sums a meter read, and the output looks identical. You get a peak demand figure carried out to three digits, built on a ramp schedule somebody guessed at over the phone.
Precision is not accuracy, and precision is what gets circulated. The number moves into a presentation, then a resource plan, then a filing, and somewhere along that path it stops being an estimate and becomes a fact. Nobody decides to make that happen. It’s what a clean number does as it travels. Meanwhile the assumptions behind it stay in the workbook, undocumented, known to whoever built the model and not necessarily anyone else.
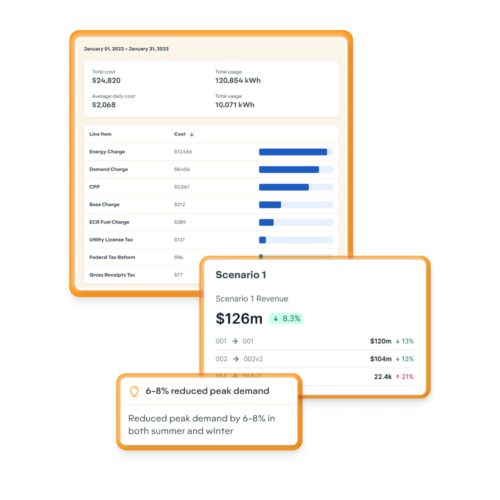
Our response was to stop treating projects as equally real. We graded them by confidence: green for high probability, yellow for projects we weren’t sure would ever arrive, red for watch and see. All of them stayed in the aggregate, because you have to know what the top of the range looks like, but the color told you how much weight to put on any given row. Then we built low, medium, and high outcomes around project timing, customer readiness, and ramp rates. Not to model every possible future, but to give planners a credible range to test major decisions against.
That was the right instinct. I’d do it again. But the execution was primitive. The color coding was manual. Every scenario meant changing assumptions row by row, and when somebody asked what happens if these projects take two extra years to get online and another year to ramp up, that required another iteration of manual editing . At the end of it, you were never fully certain you’d caught everything.
We had replaced a false single answer with an honest range, and we were maintaining that range by hand. Our intentions were good but I couldn’t help thinking there had to be a better way.
A path to sharper predictions
The instinct when you’re staring into a crystal ball is to want a better one. More data, better models, sharper prediction.
That instinct is incomplete. Some of what we were asked to predict was genuinely unknowable, because it depended on decisions the customer hadn’t made yet. No model resolves that. Pretending otherwise just relocates the guess somewhere less visible.
What we needed was to make the uncertainty legible. Say out loud which projects we believed in and why. Attach the assumption to the number so the two travel together. Update both when new information arrives, not at the next formal cycle. Show planners and regulators the range and the reasoning, not just the point estimate.
That reframes the job. A forecaster who says “peak demand will be X” is claiming something they can’t support. A forecaster who says “here’s the range, here’s what drives the spread, here’s what would have to be true for us to reach the top of it, and here’s what changed since last quarter” is doing something far more useful, and considerably more defensible when a commission asks how you arrived at a number that justifies three new plants.
The uncertainty doesn’t disappear. It gets named. Which means somebody can plan around it, price it, or decide to wait.
The best forecasting teams aren’t the ones who see the future most clearly. They’re the ones most rigorous about admitting what they can’t see, and most disciplined about keeping that admission current. Everything else is decoration on a guess.
Naming uncertainty by hand is the part that doesn’t scale, and that’s the work I’m focused on now at GridX. Scenarios that can be built and rebuilt as projects move between stages. Assumptions that stay attached to the numbers they produced, so anyone can trace why the outlook shifted. Answers that arrive fast enough to be useful inside a planning cycle rather than after it.
It’s the capability I wanted in the trenches and never had. I spent years wishing for a crystal ball. What I actually needed was a way to show my work.
That’s what the GridX Platform and GridX Forecast can bring to the planning process: the ability to continuously update forecasts and scenarios as customer loads, project assumptions, and system conditions change. Because when billions of dollars in infrastructure are riding on the forecast, the most valuable answer isn’t a more precise guess. It’s a clearer understanding of what could happen, why, and what to do about it.
Michael Pirro is Senior Director of Rate Design at GridX. He has more than 30 years of utility-industry experience across leadership roles at Duke Energy, PG&E, Florida Power & Light, and National Grid. His background spans load forecasting, rate design, resource planning and regulatory engagement, giving him a practical perspective on how utilities can respond to accelerating load growth and increasing planning uncertainty.